 Exploration
Distracted Driving Infographic
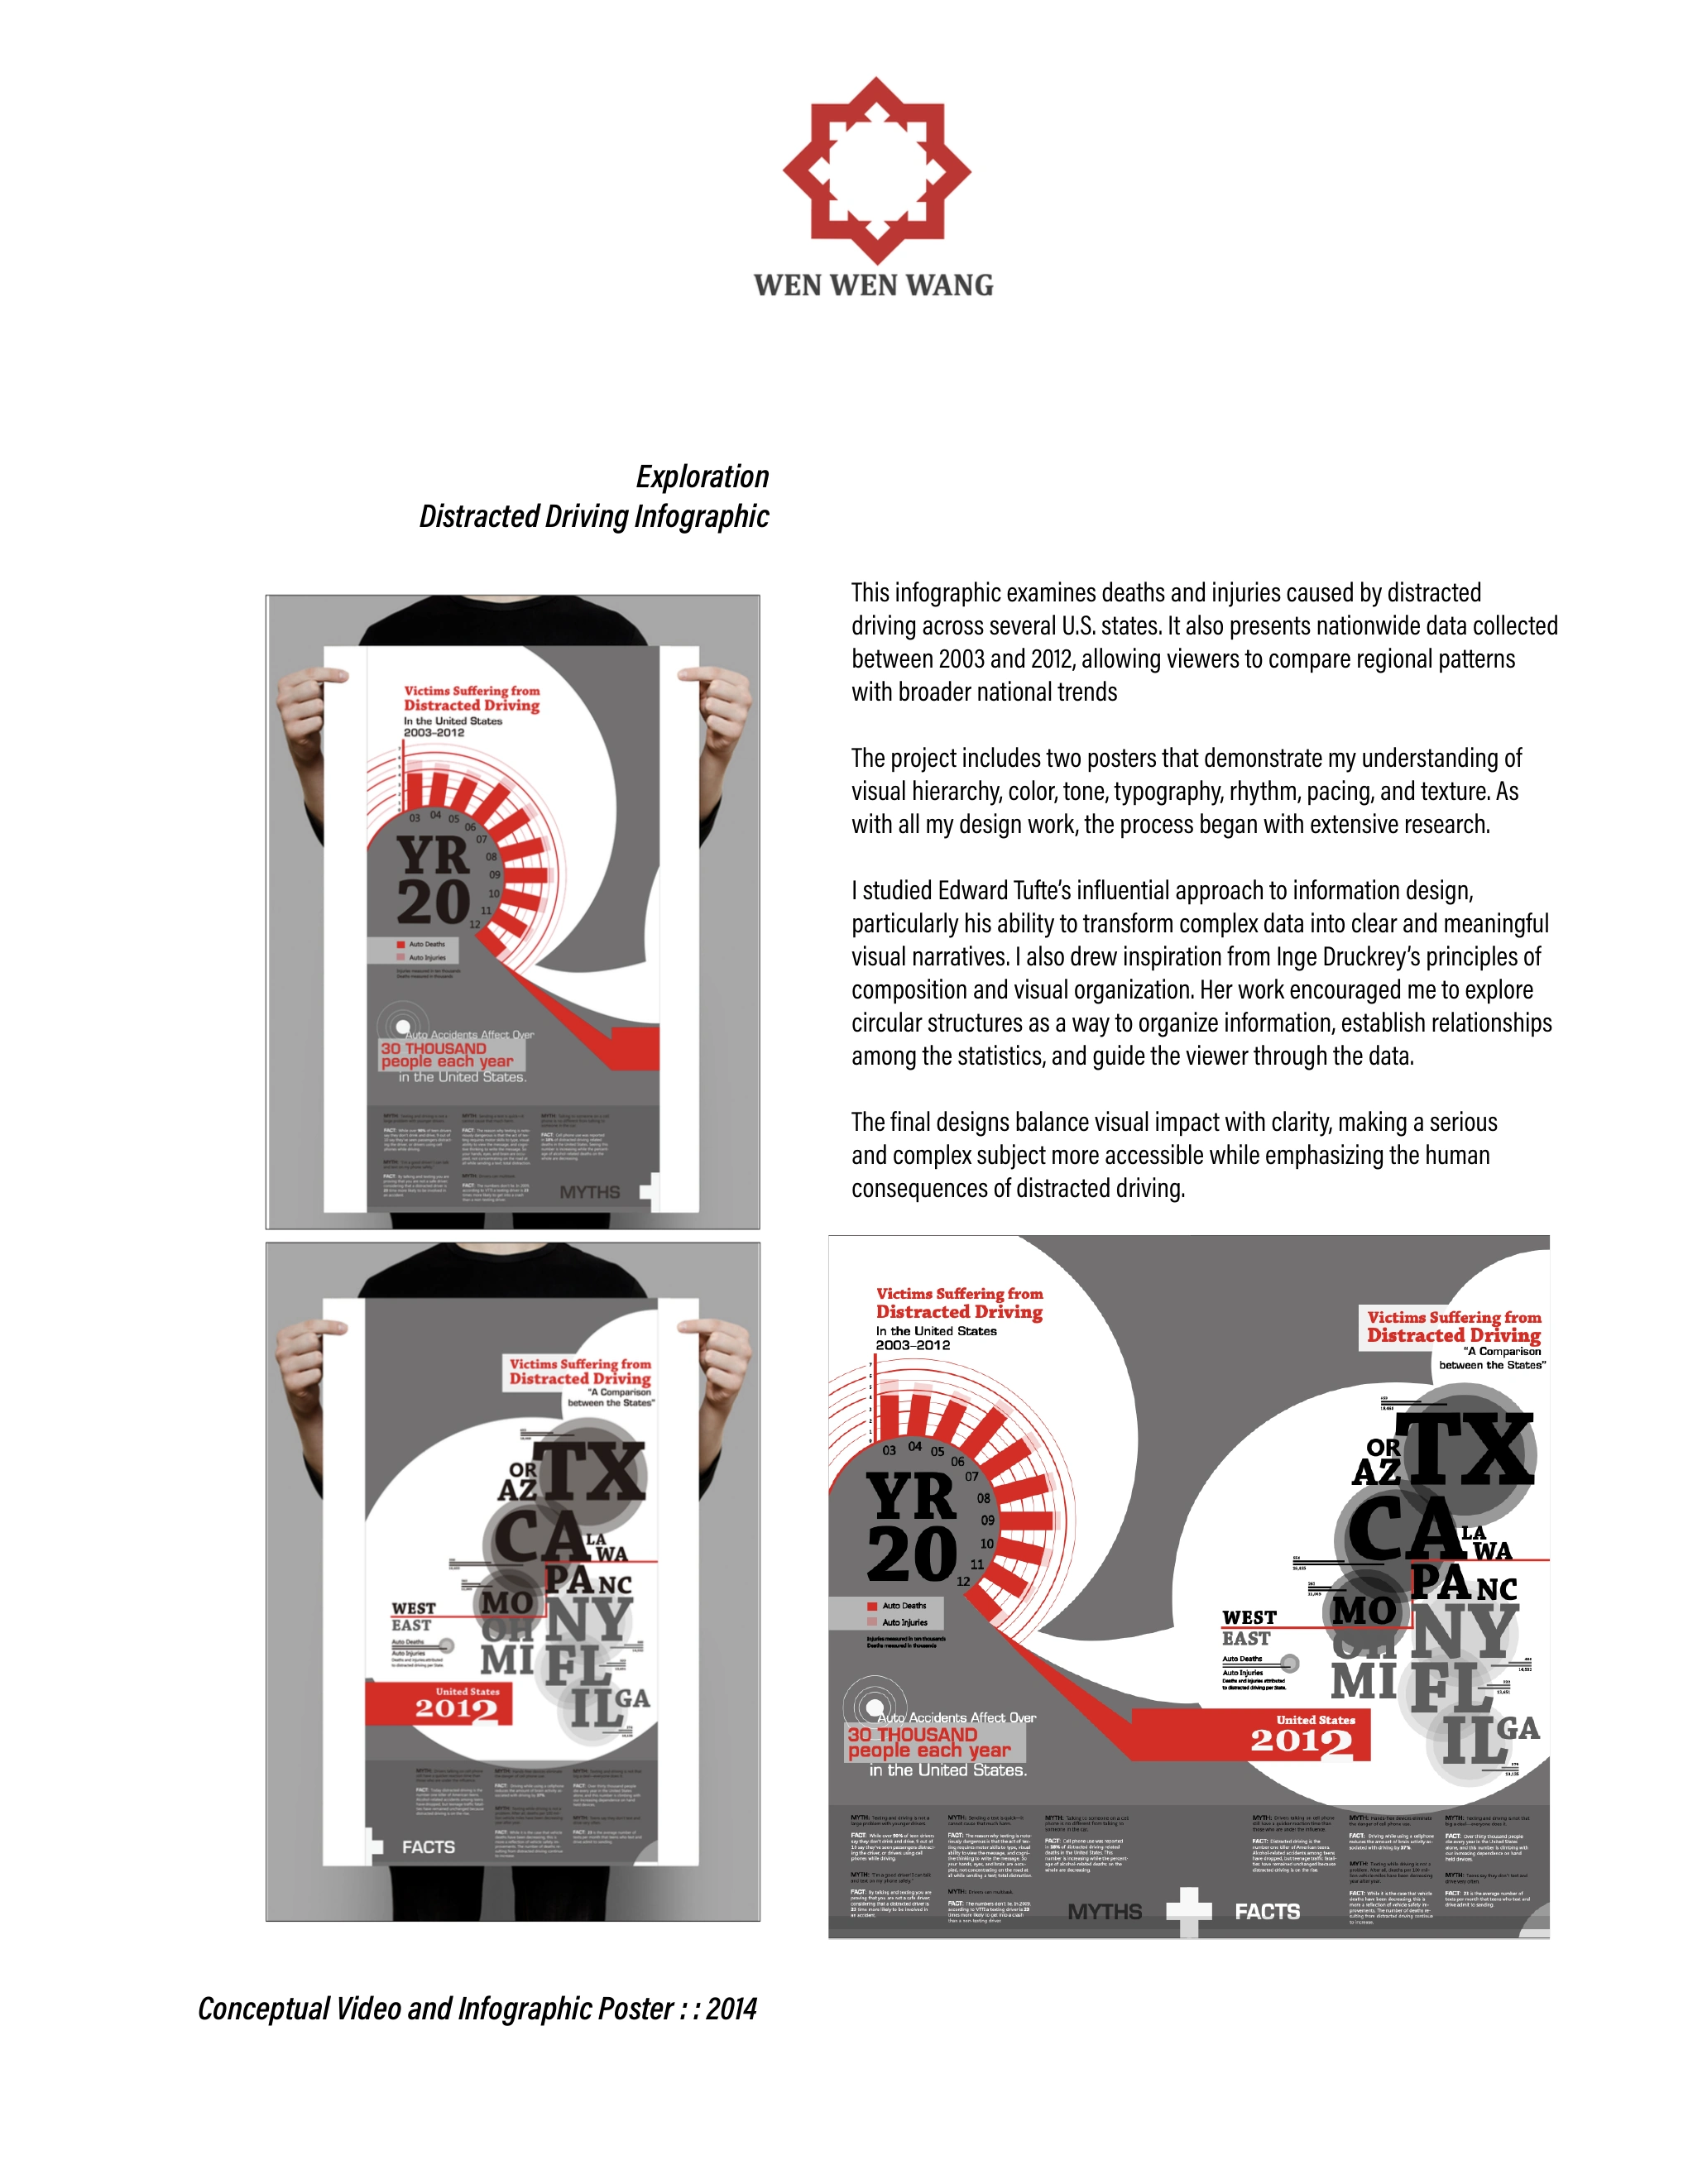
This infographic examines deaths and injuries caused by distracted
driving across several U.S. states. It also presents nationwide data collected
between 2003 and 2012, allowing viewers to compare regional patterns
with broader national trends
The project includes two posters that demonstrate my understanding of
visual hierarchy, color, tone, typography, rhythm, pacing, and texture. As
with all my design work, the process began with extensive research.
I studied Edward Tufte’s influential approach to information design,
particularly his ability to transform complex data into clear and meaningful
visual narratives. I also drew inspiration from Inge Druckrey’s principles of
composition and visual organization. Her work encouraged me to explore
circular structures as a way to organize information, establish relationships
among the statistics, and guide the viewer through the data.
The final designs balance visual impact with clarity, making a serious
and complex subject more accessible while emphasizing the human
consequences of distracted driving.
Eunam Museum of Art:: 2026
Conceptual Video and Infographic Poster:: 2014
Exploration
Distracted Driving Infographic
This infographic examines deaths and injuries caused by distracted
driving across several U.S. states. It also presents nationwide data collected
between 2003 and 2012, allowing viewers to compare regional patterns
with broader national trends
The project includes two posters that demonstrate my understanding of
visual hierarchy, color, tone, typography, rhythm, pacing, and texture. As
with all my design work, the process began with extensive research.
I studied Edward Tufte’s influential approach to information design,
particularly his ability to transform complex data into clear and meaningful
visual narratives. I also drew inspiration from Inge Druckrey’s principles of
composition and visual organization. Her work encouraged me to explore
circular structures as a way to organize information, establish relationships
among the statistics, and guide the viewer through the data.
The final designs balance visual impact with clarity, making a serious
and complex subject more accessible while emphasizing the human
consequences of distracted driving.
Eunam Museum of Art:: 2026
Conceptual Video and Infographic Poster:: 2014
Exploration
Distracted Driving Infographic
This infographic examines deaths and injuries caused by distracted
driving across several U.S. states. It also presents nationwide data collected
between 2003 and 2012, allowing viewers to compare regional patterns
with broader national trends
The project includes two posters that demonstrate my understanding of
visual hierarchy, color, tone, typography, rhythm, pacing, and texture. As
with all my design work, the process began with extensive research.
I studied Edward Tufte’s influential approach to information design,
particularly his ability to transform complex data into clear and meaningful
visual narratives. I also drew inspiration from Inge Druckrey’s principles of
composition and visual organization. Her work encouraged me to explore
circular structures as a way to organize information, establish relationships
among the statistics, and guide the viewer through the data.
The final designs balance visual impact with clarity, making a serious
and complex subject more accessible while emphasizing the human
consequences of distracted driving.
Eunam Museum of Art:: 2026
Conceptual Video and Infographic Poster:: 2014
Exploration
Distracted Driving Infographic
This infographic examines deaths and injuries caused by distracted
driving across several U.S. states. It also presents nationwide data collected
between 2003 and 2012, allowing viewers to compare regional patterns
with broader national trends
The project includes two posters that demonstrate my understanding of
visual hierarchy, color, tone, typography, rhythm, pacing, and texture. As
with all my design work, the process began with extensive research.
I studied Edward Tufte’s influential approach to information design,
particularly his ability to transform complex data into clear and meaningful
visual narratives. I also drew inspiration from Inge Druckrey’s principles of
composition and visual organization. Her work encouraged me to explore
circular structures as a way to organize information, establish relationships
among the statistics, and guide the viewer through the data.
The final designs balance visual impact with clarity, making a serious
and complex subject more accessible while emphasizing the human
consequences of distracted driving.
Eunam Museum of Art:: 2026
Conceptual Video and Infographic Poster:: 2014